Jonas Helming, Maximilian Koegel and Philip Langer co-lead EclipseSource. They work as consultants and software engineers for building web-based and desktop-based tools. …
EclipseSource Oomph Profile: ECLEmma
September 17, 2015 | 5 min ReadAs described in our previous post, we maintain a common Eclipse Oomph Profile with our favorite plugins and settings preconfigured. Using Oomph, you can get this version of Eclipse installed with a single click. See here for a more thorough introduction and how to get the pre-configured Eclipse.
As promised, we will describe the things we adapted and added to the standard Eclipse Packages. I would like to start with one of my favorite Eclipse Plugins: EclEmma. It is definitely one of the first things we add into new Eclipse installations and use it on a daily basis. EclEmma is a tool for measuring code coverage of JUnit tests. Internally, it uses the JaCoCo library, but it adds a nice integration into the Eclipse IDE on top. This integration allows you to start tests in “Coverage Mode” and subsequently display the results of the coverage analysis. To launch any existing Junit test in “Coverage Mode”, right click it and select “Coverage As => Junit Test”. In the same way, EclEmma also supports running Plugin tests. Alternatively, EclEmma adds a new launch toolbar entry, just next to “run” and “debug”.
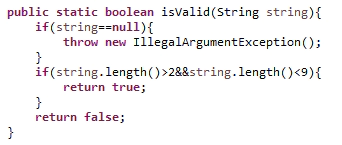
Let us look at a simple example, the following method is supposed to test if a String is longer than 2 characters and shorter than 9.
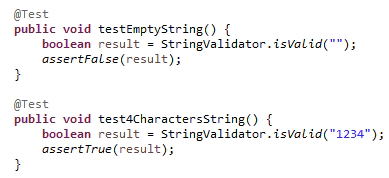
The first simple test we came up with is to test the method with an empty String (too small) and a valid String (e.g. 4 characters).
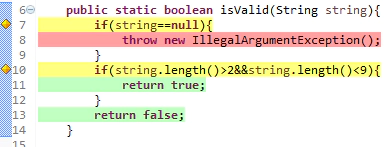
After running this test in “Coverage Mode”, EclEmma will present us with the following result:
The tool marks lines in green which were covered by the test case. Covered means, that those lines were executed. Red lines were not executed. In the example, you can see, that line 8 was not executed, so the expected exception on a null String was not tested. Yellow lines are conditions, which were only partially executed. Every condition allows different branches, e.g. the condition in line 7 could be true or false. As our current tests will only produce false values on that condition, one branch is missing and therefore, line 7 is marked in yellow. The condition in line 10 also could be true or false, both cases are covered. However, the current test cases again, do not fully cover this condition. As our condition consist of two sub conditions, combined with a logical AND, there are 4 combinations to test for this condition. If you hover over the yellow diamond in that line, you will see the number of missing branches. We currently do not test the test in which the second part of the condition becomes false, meaning if a String is longer the 9 characters. In theory, there is a fourth branch if both parts of the condition are false, but this case is impossible, as a String cannot be shorter than 3 and longer than 8.
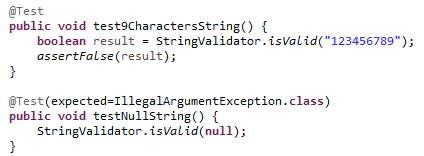
Let us add the missing test cases and run EclEmma again.
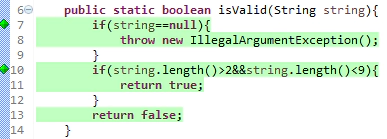
Now, EclEmma will show us all lines in green.
EclEmma also provides an overview, which shows the coverage of classes, packages and projects. This always shows the coverage of the previous test, so to get an overview, it makes sense to run all test of a certain project, i.e. its test suite. This view is a very handy tool to identify classes, which are not covered well.
EclEmma is a very useful tool to develop tests and measure their coverage. However, there is of course room for discussion, for example, how valuable is the pure measurement of this number. This is due to the fact, that code coverage alone does not automatically tell you that you have good and extensive tests. In this example above, if we delete the last line of every test, we would still have 100% coverage, but our tests would be completely useless. So, hunting exclusively for a high coverage can be dangerous, as it might create the illusion that everything is great. In turn, a low coverage is usually a sign, that tests are missing.
As usual, tools can only provide benefits, if they are used in a responsible way. In my honest opinion, EclEmma mainly helps to identify missing test cases. So I recommend to write tests first, before you measure the coverage. Then, when you think, you have covered all cases, you use it to find potentially missing cases, if there are any. From a more global perspective, code coverage tools helps you to find packages, components or classes, which have a low coverage. Measuring the global code coverage on a build server provides you with a global indicator of how extensive the current test base is, however, without a detailed look, they are just “hints”.
There are additional tools, which go a step further and even allow you to measure the quality of the assertions of tests. As we also include them in our Oomph profile, I will describe those in a future blog post.
It is clear from this discussion, EclEmma is one of the most frequently used tool for us and truly deserves a place in our EclipseSource Oomph Profile. We want to thank the developers, especially Marc Hoffmann for his great work.
If you know any other great tools like this, of course, it is always possible to install it into your IDE and therefore extend our Oomph profile. If you think a certain plugin might be interesting for the majority of users, please get in touch with us, so we can consider adding it to the original profile.
You can report issues and feedback using this github project.
In our next blog posts, we will describe some more of the additional plugins, we added to our Oomph profile. For an overview, all posts are linked here. I will also post all updates on the profile in this blog, so please follow us to be notified about those.
Until then, have fun using the EclipseSource Oomph Profile!
