Jonas Helming, Maximilian Koegel and Philip Langer co-lead EclipseSource, specializing in consulting and engineering innovative, customized tools and IDEs, with a strong …
CDT Cloud Blueprint: Debugging
October 24, 2023 | 3 min ReadLooking for a modern, web-based IDE for C/C++ development or aiming to develop a custom C/C++ tool? Dive in! This blog post highlights the debugging features of CDT Cloud Blueprint.
Before we dive into the specifics, let’s make sure you have all the information you need for trying it out: CDT Cloud Blueprint is available as a downloadable desktop application or as a web-based IDE, which you can try online instantly without any installation.

CDT Cloud Blueprint is not only a tool you can use for generic C/C++ development. It also can serve as a basis to build your own custom C/C++ tools. In this article, we’re shining a light on its feature-rich debugging support, including powerful features such as watch expressions and conditional breakpoints.

CDT Cloud Blueprint uses the Debug Adapter Protocol (DAP) to enable debugging sessions, separating its debug UI from the actual debugging space. The communication between the debug UI and the process being debugged is on a generic protocol (DAP), which is the same as in VS Code. This enables CDT Cloud to interface with any debugger that speaks the DAP. “Anything” can be a simple C/C++ program, but also, for example, a device with debug probes. Furthermore, CDT Cloud Blueprint includes the CDT-GDB-Debug Adapter that translates between GDB and DAP. Thus, you can also debug via GDB.
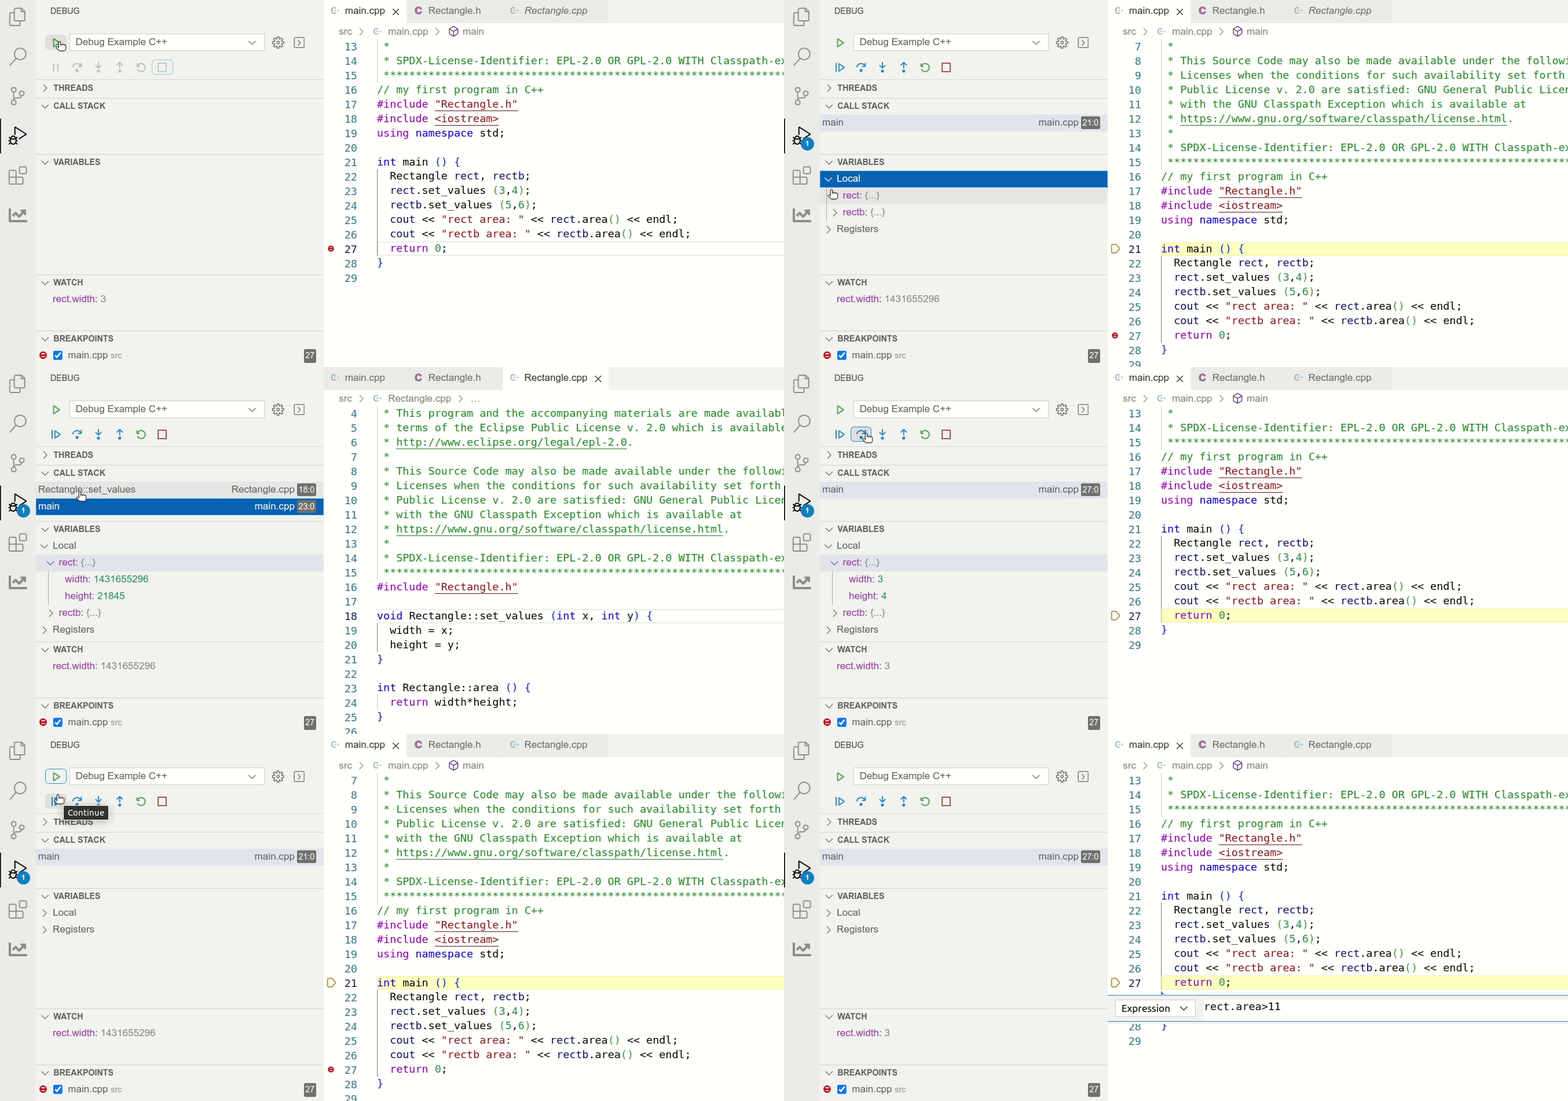
The screenshot below shows an example debug session of a simple C/C++ program in CDT Cloud Blueprint. As you can see, you can step through the code. The variables section displays all variables and their values currently in scope. Under “Watch”, you can add custom expressions to observe specific things (in this case “rect.width”). The section “Breakpoints” shows a list of all breakpoints that have been added in the code. With a right click on the breakpoint, you can even add breakpoint conditions (“edit condition”). In the popup, you can enter an expression. If this expression returns true, the breakpoint will hit, otherwise it will be ignored. This is very useful to stop the program only under specific conditions, e.g. when debugging a loop, you can stop at a specific iteration.

However, there is even more: CDT Cloud not only provides a debug adapter for GDB, which is designed to be highly customizable for improving the support of specific targets, but it also provides the CDT Debug Adapter Amalgamator, enabling you to control and combine multiple debug adapters into a single debug adapter interface to achieve a more straightforward debugging experience in complex debug scenarios (e.g. multiple devices or processes that interact with each other).
In addition, CDT Cloud allows the user to inspect the current state of the memory and registers via its powerful memory inspector. We will introduce this feature in more detail in a follow up article. Follow us on Twitter to get notified about future articles.
Please remember: you can download CDT Cloud and install it or you can try it online, both for free!
If you are interested in building a C/C++ tool (online or offline) or migrating an existing one to a modern technology stack, EclipseSource has many years of experience in developing custom C/C++ tools. We can assist you in the conception phase, and also the design and the development of your toolchain. Please have a look at our service offering for tools and web-based tools.