A look at the Internet Explorer 11 Developer Tools
November 25, 2013 | 7 min ReadEver since the release of Internet Explorer 9 Microsoft has put a very noticeable effort into catching up to other browser (specifically Chrome and Firefox) in terms of compatibility and performance. The results haven’t been half-bad, especially considering they added HTML5, CSS3 and SVG support seemingly overnight. Of course, MS easily has the resources to do such a thing - and then pay for a stylish ad-campaign with licensed music on top of it:
No, more interesting is the apparent change in attitude. MS used to push IE mostly by bundling it with other software, including it with its operating systems, and enforcing it’s own standards while not giving a damn about official ones. (Though neither did their competitors at the time.) Now (as of IE11 that is) they not only included most of the HTML5/CSS3 goodies I could ask for, they even (gasp!) stopped supporting their own failed technologies. In their marketing MS even goes so far as to flat out admit that IE (used) to suck while appealing to the 90’s nostalgia of today’s better-earning 30-somethings or even internet geek culture.
 Yes, this is a real Internet Explorer ad. (For the asian market.) (Source)
All this marketing screams “we learned our lesson”, while kind of keeping quiet about the fact that they really did not have much of a choice. Had their attempt at pushing their own Flash alternative taken of, IE9 might have looked very different. The reality is that big corporations only change very slowly, and so does their software: Traces of the “old” IE are still well visible in the newer ones. (The “modern”/“metro” version of IE is a slightly different story.) The most obvious legacy of IE8 are the Developer Tools, which really didn’t improve that much in 9 and 10. They were severely lacking functionality compared to Firebug and the Chrome Tools, and really, really ugly to look at.
Well, they fixed that latter problem. The dev tools of IE11 had a facelift and are now much more in tune with the “modern” (i.e. “metro”) look of Windows 8. But can they hold a candle to Firebug & Co? I don’t have time to check every single feature, so I will compare mainly the three features I use most in a browser’s developer tools: The JavaScript console, the DOM explorer and the debugger. I
The JavaScript Console
From their beginnings the Chrome Tools and Firebug had a powerful JavaScript console with history, auto-completion, and a nicely formatted (and even interactive) output of JavaScript values. IE did not. Let’s see how IE11 does.
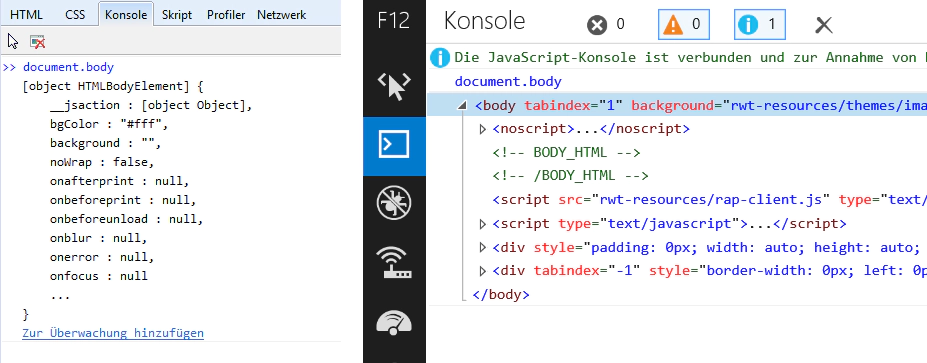
Typing “document.bo” opens a popup suggesting “body” and “onabort”. It’s not highlighting the part that I already typed (“bo”), but at least there IS auto-completion. IE10 didn’t have it at all, which was very annoying at times. After completing the command IE gives me the syntax-highlighted HTML code for the documents body element, which can be expanded much like in Chrome. Firefox dev tools and Firebug behave a bit different, but this is certainly a very good way to output a DOM element, and much better than the ugly, incomplete summary given by IE10.
However, attempting to print any a JavaScript value with the console logger still behaves like in IE10 (or IE8 for that matter), e.g. “console.log( { "foo" : "bar" } )” results in the very unhelpful output “[object Object]”. Boo!
Command history support (using the up/down keys) is available, but that’s been there since a few versions now, it just seems slightly improved. Disecting the console object reveals a couple of new commands, especially, finally, thankfully a “trace” method to print a stack trace. Yay! But unlike Firebug the trace does not include function parameters, and unlike both Firebug and Chrome, you can not click in the trace to jump to the code! Boo again!
At least it seems that the “console” object is now present even if the developer tools are not open. This was not the case before and often resulted in crashes when debugging code in multiple browser simultaneously.
DOM Explorer
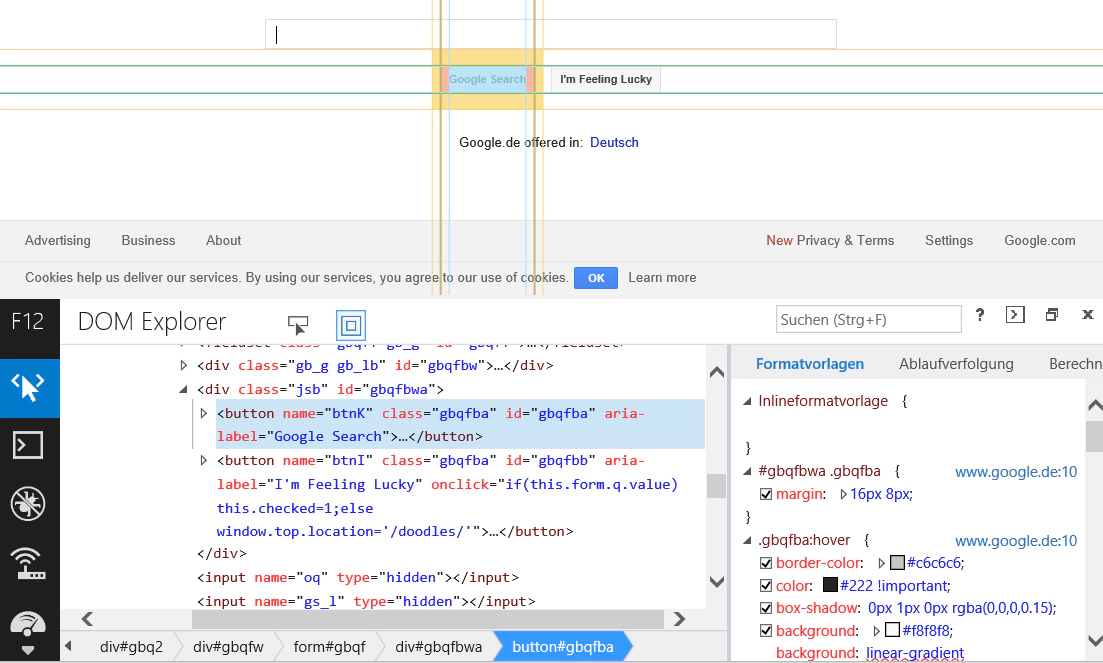
At a first glance the DOM explorer does not look very different, but there is one very noticeable change: The “refresh” button is gone. Up until IE10 you had to press that button every time before inspecting the DOM, otherwise you would get an “outdated” version from when you opened the explorer. Now you can see the changes in real-time, which is definitely a welcome improvement. Also, the highlighting of the elements within the document now also visualizes the padding and margin as it does in other browser. It looks rather nice, overall there is nothing much to complain about. The right-hand view that gives you details on the selected element still seems rather clunky to me, but it does its job and this view isn’t perfect in any of the other browser either, at least in my opinion.
Debugger
Like everything else the debugger looks nicer now, but the changes are actually less superficial. The icons at the top of the new layout reveal a bunch of new features, such as the option to pause on all or only on uncaught exceptions.
The folder icon to the left opens a popup with a nicely structured tree of all scripts and a filter textbox. If you need a bunch of scripts among dozens or even hundreds, you can now easily find them and open them all simultaneously within the debugger in separate tabs. (However, some scripts that were added to the document using document.writeln were not named correctly.) If your script is minified/obfuscated, you can now let IE pretty-print it for you, which it does even to very large scripts in a reasonable amount of time - certainly much faster than older IEs needed just to load a huge script.
The actual step-by-step debugging revealed no bigger issues, though this (surprisingly) already worked pretty well since IE8. The details view to the right is certainly much more clearly arranged than before. The debugger statement also works fine. There seem to be some smaller quirks though, for example the developer toolbar can not be re-sized while a script is paused. Overall the IE11 debugger reminded me of a slightly unpolished version of the current Chrome debugger.
Other Stuff
The developer tools are still only available if you run IE in desktop mode and not in the “metro” version, though that’s not a big loss I guess. When running a document in a compatibility mode for older IE versions, some of the newer feature don’t seem to work quiet right, sometimes even crashing my entire browser. A quick look at the “network” tab does not reveal any significant changes, you still have to explicitly start recording requests. The JavaScript profiler was already pretty solid before and still is, but now there is also a timeline feature. It shows you how much time the browser needs not just for JavaScript execution, but also for rendering, garbage collecting and so an. You can also take heap dump to identify memory leaks. Both new features seem very similar to what the Chrome tools already do, which isn’t a bad thing.
Conclusion
Well, the verdict was pretty predictable: “We’re getting there.” IE11 does for the developer tools what IE9 did for the rendering engine: It brings them up to the current minimum requirements to pass as a modern browser, but it still feels nowhere near as polished and substantial as the others. A big step forward just isn’t enough if you’re several miles behind. That being said, it still makes my day-to-day work as a RAP committer a bit easier, so I’m inclined to applaud the changes anyway. I’m actually kind of rooting for IE (and Firefox), since the current dominance of Webkit browser could theoretically lead into the kind of oligopoly we had in the late 90s, which isn’t really healthy.
Plus, Inori (the semi-official IE11 mascot) is super-cute:
がんばって!


