Visualizing data with D3
July 18, 2013 | 2 min ReadUsing visualization to extract knowledge from data is one proven approach for dealing with large amounts of data. Today I would like to introduce you to D3, an intriguing JavaScript library for visualization.
From the D3 introduction: D3 allows you to bind arbitrary data to a Document Object Model (DOM), and then apply data-driven transformations to the document. For example, you can use D3 to generate an HTML table from an array of numbers. Or, use the same data to create an interactive SVG bar chart with smooth transitions and interaction.
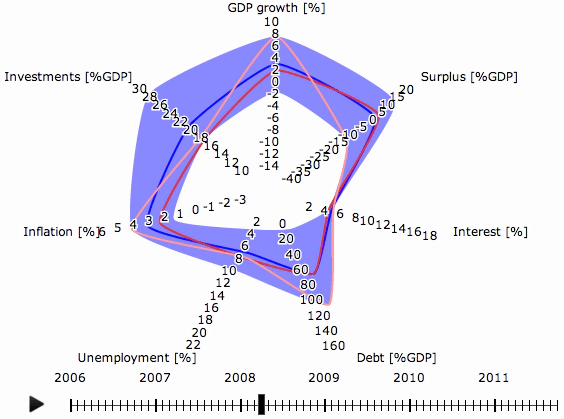
One thing that I like particularly about D3 is the capability to interact with the data. Have a look at the following example: It is a chart with a number of “health” indicators for the Euro zone: You can both slide through the time and inspect specific countries roles in the graph.
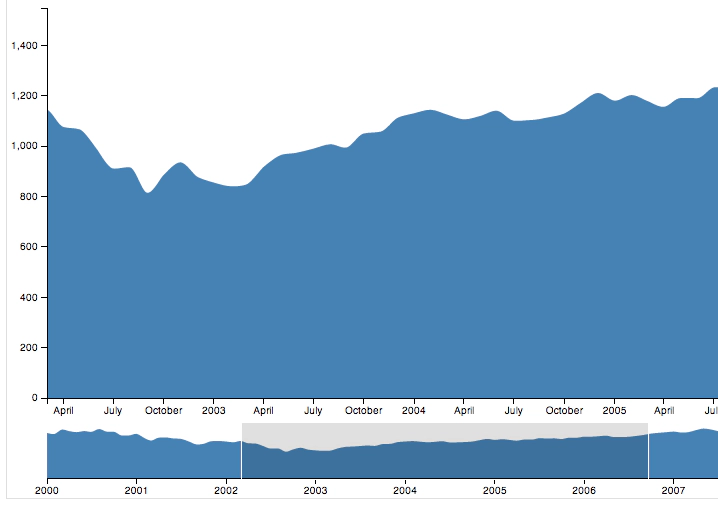
Data can be supplied as JSON, but it also possible to use CSV or other common file formats. This makes it quite easy to get started. Another cool example is this timeline that allows to focus / zoom into periods.
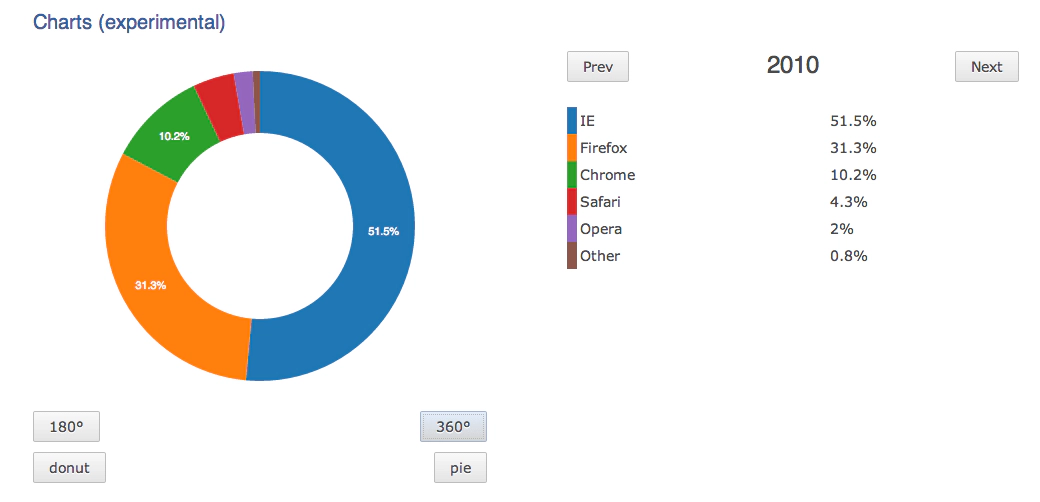
D3 is not only very impressing, but also Open Source. My colleague Ralf has been playing around with D3 a bit and integrated it into the RAP demo application. The controls for interacting with the diagram are rendered with RAP, the chart is rendered with D3.

[1] D3 website https://d3js.org [2] Euro crisis chart https://www.larsko.org/v/euc/ [3] Interactive Time Series https://bl.ocks.org/mbostock/1667367 [4] RAP Sample Demo http://rap.eclipsesource.com/rapdemo/examples#chart

