Creating Tomcat heap dumps on Windows
January 31, 2013 | 4 min ReadOne option for detecting memory leaks in Java is the analysis of heap dumps. The first step is to create an HPROF heap dump from the running Java application, the second is the analysis of the dump with an appropriate analysis tool like jvisualvm or Eclipse Memory Analyzer (MAT). Wanting to do the first step for a running Apache Tomcat on Windows, I found that creating the dump is not as trivial as it seems, especially if Tomcat is run as a windows service. This post is a description of my experience with three tools available with the JDK.
Tomcat run from the console
If Tomcat is started using the start batch script, getting the heap dump is not hard. The JDK offers three different tools for the task - they can all be found in the bin folder of your JDK installation. Of course external tools like Eclipse MAT can be used to create dumps as well (as Ian Bull described in his recent post), but they are usually not installed on the target system, while the JDK likely is.
jmap
jmap is a command line tool used to get information about the memory map of a running Java application. To create a heap dump, execute the following line from a DOS prompt:
jmap.exe -dump:format=b,file=c:\temp\HeapDump.hprof
pid is the ID of the Java process. The JDK offers another tool called jps to list the IDs of all running Java processes. Executing jps.exe on the command line should print out something like this:
4711 jps 8442 Bootstrap
The Java process called Bootstrap is the running Tomcat.
jconsole
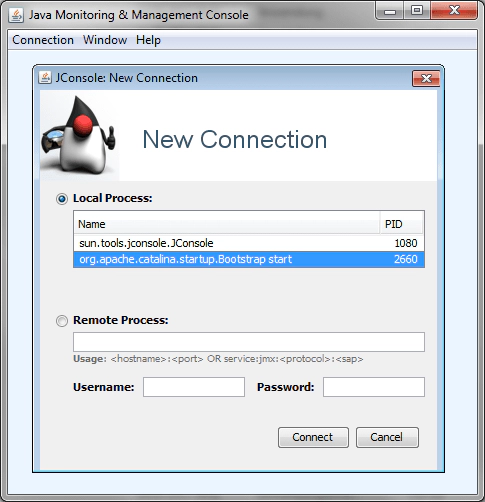
jconsole is a monitoring tool for Java applications that comes with a user interface and uses Java Management Extensions (JMX). Conveniently it can also produce heap dumps. Type jconsole in the command prompt and select the Java process called Bootstrap:
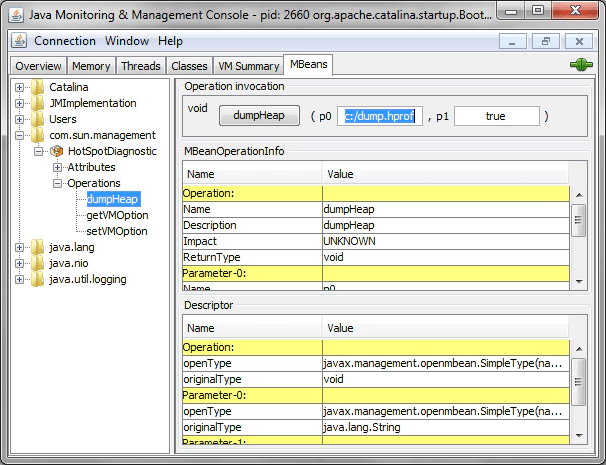
Switch to the MBeans tab and select com.sun.management - HotSpotDiagnostic - Operations - dumpHeap in the tree on the left. Pressing the dumpHeap button creates the heap dump. The parameter called p0 allows you to specify into which target file the heap is dumped.
jvisualvm
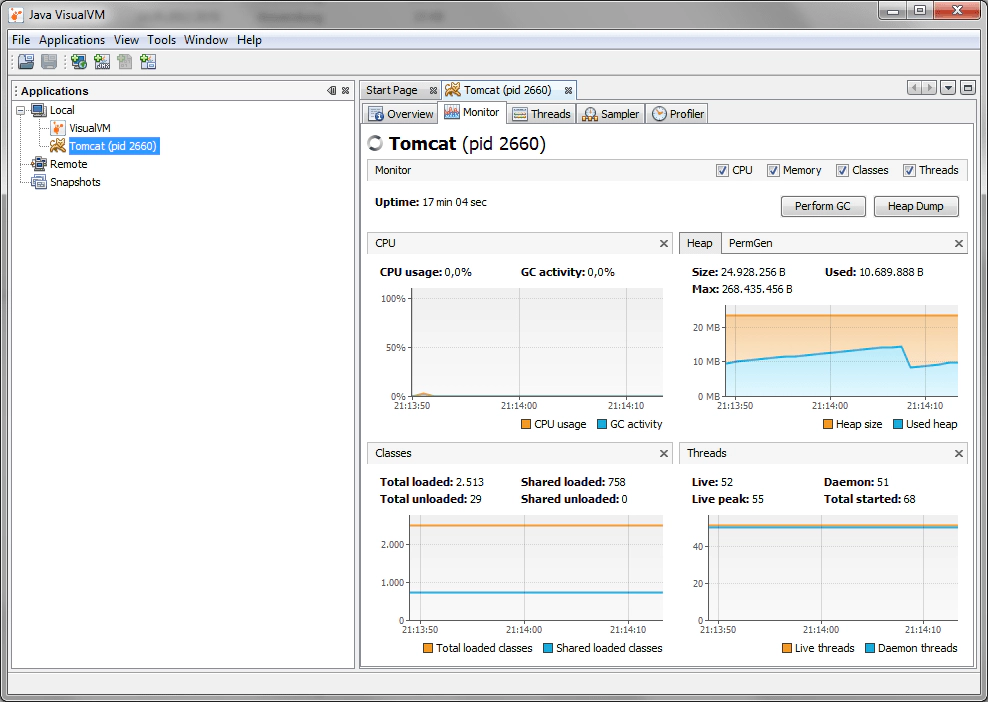
jvisualvm provides a graphical user interface for monitoring and profiling Java applications. Simply type jvisualvm at the command prompt. The UI will recognize the running Tomcat and display it in the tree on the left. Double-click it and switch to the Memory tab. Press the Heap Dump button to create one.
Tomcat run as a service
The world gets more complicated when Tomcat is run as a Windows service. This prevents the standard JDK tools from recognizing Tomcat as a Java process.
jmap
The first problem is to get the process ID because jps does not list the Tomcat service as a Java process. Fortunately, the Windows Task Manager lists the service in its Services tab, including its PID. However, if jmap is called with this PID (make sure to run it as Administrator), it refuses to create a dump with the error message
Not enough storage is available to process this command.
I could not find a way to solve this. If anyone has, please comment.
jconsole
When starting jconsole, the Tomcat process is not listed in the selection dialog. One way to create a connection to the service is to instrument the Tomcat service for JMX remote. Just add the following Java system properties to Tomcat (for example in the Java tab of the Tomcat Monitor):
-Dcom.sun.management.jmxremote -Dcom.sun.management.jmxremote.port=8086 -Dcom.sun.management.jmxremote.ssl=false -Dcom.sun.management.jmxremote.authenticate=false
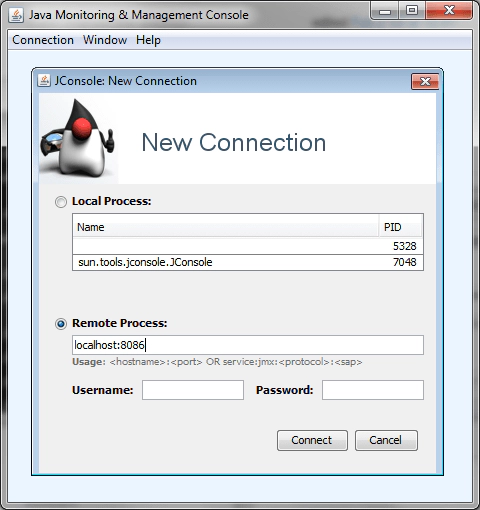
Once Tomcat is prepared like this (and restarted), jconsole can connect to it using the Remote Process:
Thread dump generation then works as described above.
jvisualvm
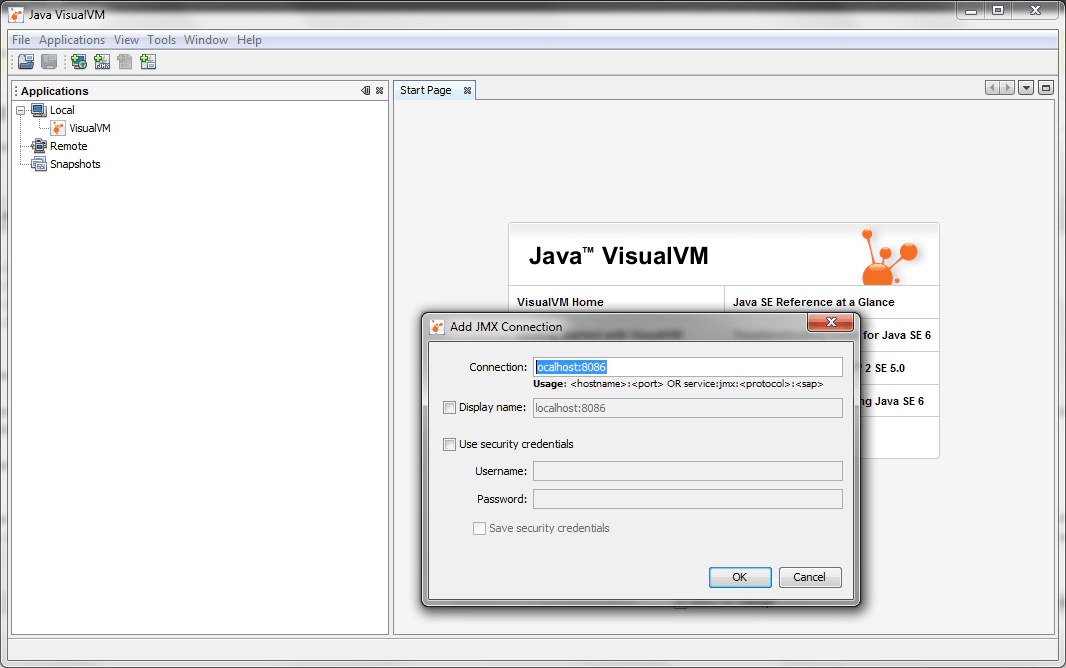
jvisualvm has the same problem: the Tomcat process is not recognized as such. Here the JMX instrumentation of Tomcat helps again. Select File - Add JMX Connection… in the main menu of jvisualvm and enter localhost:8086 as a connection string. Then jvisualvm can connect and create the dump.
These instructions worked well for us to create heap dumps with Tomcat on Windows. If you know other ways, please leave a comment.
