Visualizing OSGi Systems
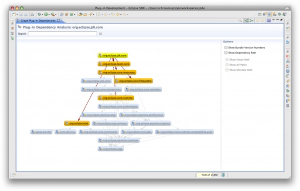
At the recent OSGi Tool Summit, one of the biggest discussion items that came up was visualization. This makes perfect sense to me as visualizations can be a powerful tool, whether it’s for reviewing your architecture or sharing information with colleagues. In the OSGi world, I only know of two projects starting to scratch the surface of visualizing OSGi systems: PDE and Knopflerfish. Since I co-lead PDE, let me speak about what I know best. In PDE, I recently published a new build of the PDE Visualization project:
To install, point Eclipse (Help->Install New Software…) to this repository (make sure you have the Galileo or Ganymede repository in your list of repositories so p2 can reason about the dependencies). I recommend using Eclipse 3.4 or later too.
A couple days ago, I spent some time polishing the visualization code and pondering about what functionality is missing. First and foremost, the biggest thing missing is the ability to visualize packages and services. Currently, it’s only possible to visualize bundle-level dependencies and the only reason this is the case is because noone has spent time to add support! Another cool feature that’s missing in my opinion is to measure dependency extent. Imagine for a second if the screenshot above included information on the weight of a dependency… for example the lines could be thicker to signify how “strong” of a dependency org.eclipse.jdt.core has on certain bundles. This type of information would allow us to potentially prune bundles that we didn’t really need or catch mistakes where we bring in one bundle that depends on the “rest of the world.” There’s so many possibilities when you start thinking about it!
What do people out there want to see in their OSGi visualization tools? Any crazy ideas?
If you’re interested in helping the PDE Visualization project move forward, let me know and I’d love to help you contribute. In my opinion, it would be a great opportunity to get invovled with PDE and potentially the Zest project (which powers the visualizations). Don’t be shy and feel free to shoot me an email.
