(Yet) Another Charting Widget for RAP
July 21, 2014 | 2 min ReadMaybe you’re familiar with Ralf Sternberg’s d3 widget for RAP (it’s part of the RAP Examples Demo). Like the name implies, it’s a charting widget based on the d3 library, which uses SVG to render its elements.
I was interested in doing the same with the other popular method used to draw freely in a modern browser, the HTML5 canvas element. The most promising project I found for that is Chart.js, a pleasantly simple and lightweight charting library that’s currently in its 1.0 beta phase.
The original idea was to keep it as simple as possible while also making it work on IE7/8 (unlike the d3 widget), but that didn’t work out to my satisfaction. After letting it rest for a while I decided to publish the project without IE8 support, a move made easier by our plan to drop IE8 for RAP 3.0 as well.
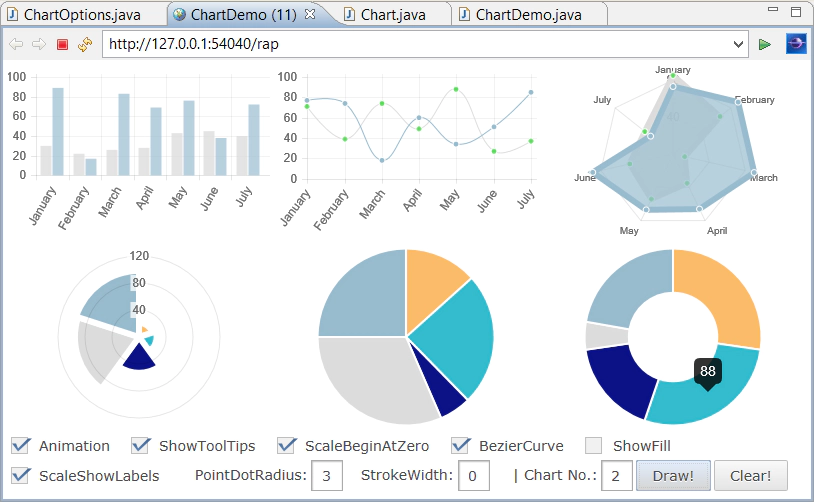
Chart.js supports 6 basic chart types that feature optional tooltips, appear animations and limited customization. The Java API is fairly close to the original JS API and pretty self-explanatory. Just create an instance of the Chart class and call one of the 6 draw***Chart methods. The first argument is the data object (instances of either ChartRowData or ChartPointData), and the (optional) second a configuration object (instance of ChartOptions). You can call these methods as often as you want, the previous chart will simply be replaced. There are currently no transitions between two charts. I experimented with this, but it made everything insanely complicated, which is exactly what I didn’t want. Perhaps in a later version.
Speaking of later versions, from my point of view this is just an experiment, but if there is some good feedback I might polish it up a bit and contribute it to the RAP Incubator. Be sure to try the d3 widget as well.
