Ian is an Eclipse committer and EclipseSource Distinguished Engineer with a passion for developer productivity.
He leads the J2V8 project and has served on several …
With all the great work going on in the Eclipse Run-time space, like the EMF Runtime, RAP, Birt Charting Engine, ECF, Jetty and of course Equinox, I sometimes forget that Eclipse started as an excellent platform for tools. The Eclipse Memory Analyzer project reminded me just how good Eclipse tools are.
All week I have been counting down the top 10 Galileo features that I’m most excited about. Number 5 on my list is the Eclipse Memory Analyzer (MAT). This project was first released in December 2008 and is now part of the Galileo release train. MAT provides a large selection of features to help you analyze Java heap dumps to understand your memory consumption and help remove leaks.
As you may have noticed, many of my posts focus on the simplicity of the new features. The MAT project is no different. Getting started with the Memory Analyzer is a simple 3 step process:
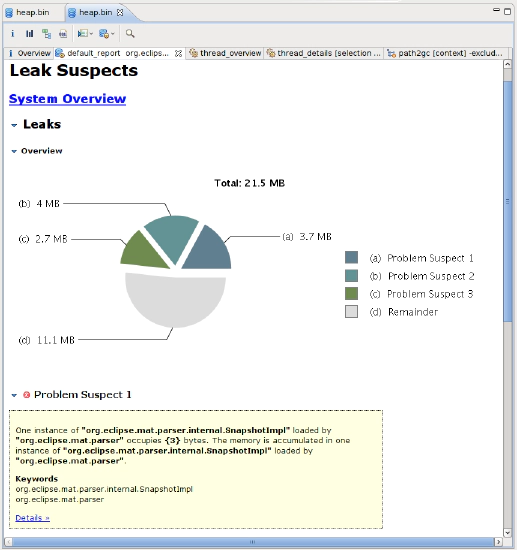
Some of the notable features include:- The reporting of memory leak suspects:
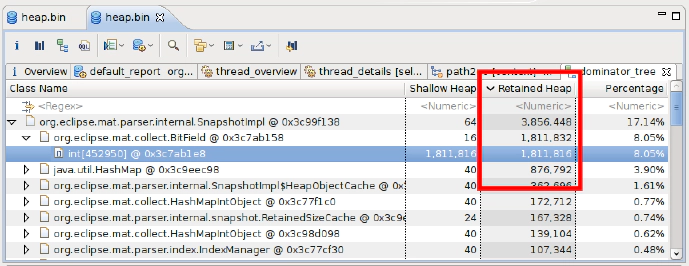
Calculating Retained Sizes (How much memory is used, rooted at a particular object):
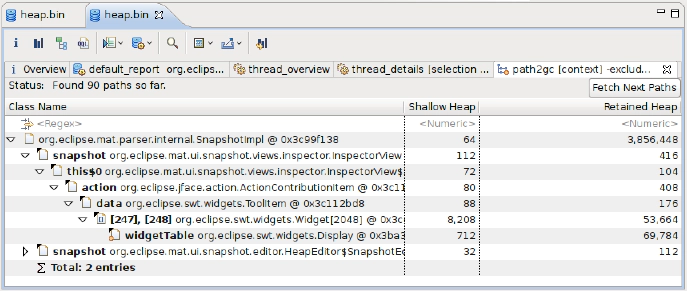
Track the pointers back to the GC (garbage collection) roots:
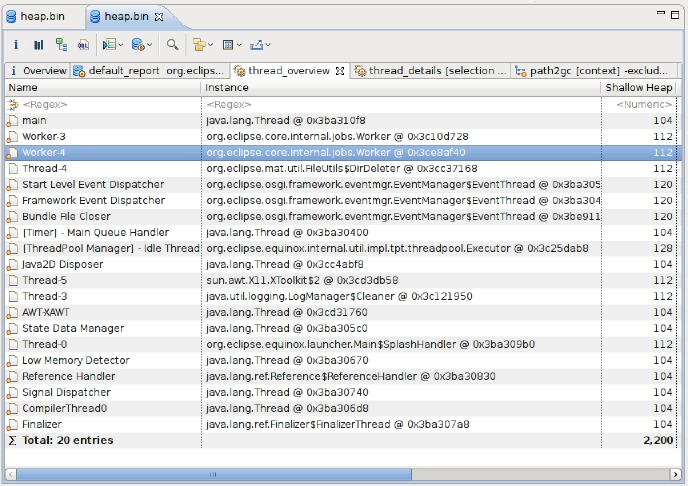
Thread and Stack information:
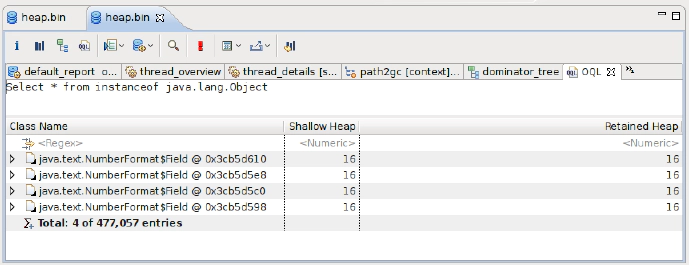
SQL-like language for querying the heap:
Shout-outs for this go to Andreas Buchen and the entire Memory Analyzer team. Thank-you for guys for such an awesome (and unbelievably useful) tool!
Note: I got these examples by running the memory analyzer on Eclipse, after analyzing a 670 Meg heap. It’s unbelievable, but the MAT heap was only 21 Megs. 21 Megs used to analyze over 1/2 a Gig. How cool is that?
Ian is an Eclipse committer and EclipseSource Distinguished Engineer with a passion for developer productivity.
He leads the J2V8 project and has served on several …